Finance
Guest Commentary: The generalist investor blame game
Real data refute the long-held generalist hypothesis of life sci market moves
Among the most popular explanations for the significant equity market moves in the life sciences sector over recent years has been the seesawing sentiment of generalist investors. The concept has become market dogma, rolling effortlessly off the tongues of investors, analysts and bankers, as well as the pens of financial journalists.
The basic thesis is that upward movement in stock prices is driven primarily by expanding interest in the sector by generalists, including retail investors, overshadowing the presumably more stable and sustainable interest by specialists, whose only real asset-class decision is between sector-specific investment and cash.
Likewise, downward movement is presumed to be led by generalists abandoning the space "until stocks begin working again," with specialists tagging along, perhaps less systematically, to avoid getting steamrolled by the negative momentum. In this context, specialists are relegated, almost definitionally, to a secondary role and exert little market influence, at least in the aggregate.
Rarely (if ever) is that core generalist proposition challenged or questioned, despite some obvious logic flaws, not least of which is that it draws an implicit distinction between two types of investors whose basic behavior is, or should be, more similar than different -- all investors, regardless of type or size, can be expected to rally in response to good news and retreat in response to bad news.
It also stands at odds with the reality that private and public financings in life sciences have long been dominated by specialists, notwithstanding the generic rhetoric from bankers about their unique access to broader, generalist pools of capital to allow their corporate clients to avoid being held hostage in deal pricing by the same group of usual suspects on the specialist side.
The truth is that a relatively small group of known healthcare-focused venture, crossover, hedge and long-only funds has for years predominated in the investor syndicates and pot lists of life sciences financings.
Hypothesis
If correct, the basic argument would have two obvious and measurable implications.
First, the anticipated mix of generalists and specialists should roughly track underlying market movements over time, with the proportion of generalist ownership in a particular company increasing in strong markets and declining in weak ones.
Second, there also should be a pronounced difference in the relative mix of generalist and specialist investors between larger and smaller cap companies. The investment profiles of the larger caps like Gilead Sciences Inc., Amgen Inc., Biogen Inc. and Celgene Corp. presumably appeal to the skill sets and risk tolerance of the generalists. These investors might be expected to be more comfortable considering conventional financial metrics and analyses of sales, marketing, product pricing, addressable markets and reimbursement, and perhaps less inclined to perform in-depth analyses of raw science and fundamental clinical data.
By contrast, the smaller caps, particularly the precommercial companies, offer little in the way of conventional financial metrics and require specialized knowledge of science and therapeutic relevance, long the presumed province of the specialist investor. After all, they're specialists.
Methodology
We set out to test the hypothesis by comparing the shareholder composition of stocks in the NASDAQ Biotechnology Index (NBI), a standard barometer of life sciences sector performance reflecting a comprehensive range of market caps and clinical/commercial profiles.
We segmented the analysis into two cohorts -- the top 50 and bottom 50 by market cap. Any additions to the index during the study period were reflected when data became available (usually the first filing quarter following IPO). Companies deleted from the index during the study period due to acquisition or bankruptcy were excluded for the entire study period.
The analysis compiled quarterly data from standard institutional fund filings on Schedule 13D for the top 20 reporting shareholders of each stock for 21 quarters, starting with the quarter ended Dec. 31, 2010, and ending with the quarter ended Dec. 31, 2015. This period began after the broader financial crisis of 2008-10 had largely subsided.
We excluded, per convention, index funds and broker-dealers and collected the absolute number of shares held by each investor by company by quarter. We then assigned a generalist or specialist label to each of the 994 discrete investors that emerged from the screen and calculated the percentage that generalists represented of the top 20 investors per company per quarter. The resulting 42,000 data points (20 investors x 100 companies x 21 quarters) assured a reasonable degree of statistical significance.
The labeling exercise required some judgment, but the defining categorization of investors is generally straightforward and broadly accepted. We did lump into the specialist pool those generalist funds within the larger, diversified fund complexes that also possess a recognized specialist identity in life sciences, such as Fidelity, Janus, Jennison, T. Rowe Price and Wellington. To capture any bias with respect to the larger funds, we also ran a second cut of the analysis in which those funds were moved into the generalist pool.
Of course, tracking the simple mix between generalists and specialists by company by quarter and then aggregating the data is not dispositive evidence that no movement in holdings has occurred -- such an analysis would ignore any trading between generalists that could create upside or downside trading pressure, with specialists standing pat and leaving the generalist/specialist mix unchanged.
In addition, restricting the analysis only to the top 20 investors per company per quarter, instead of the full list of 13D filers, may bias the data in favor of the larger investors and, by extension, the larger cap companies. More broadly, the analysis segregates investors into one of only two categories -- generalists or specialists -- thereby drawing no distinction between long-only funds, hedge funds, and crossover investors, among others, and their differing investment styles. Each of these limitations may merit further study.
Results
Generalist ownership in the top 50 NBI companies, as predicted, clearly exceeded that in the bottom 50 NBI companies (see "Levels of Participation").
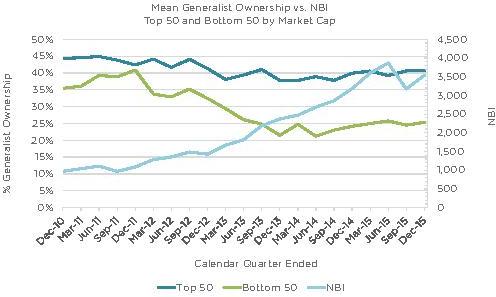
The threshold comparison of generalist ownership by quarter and underlying market moves, however, produced no definitive correlation over the study time frame. If anything, the mean generalist ownership over this period was flat to down, despite the steady upward move in the broader life sciences market over 2012-15 -- an apparent inverse correlation that would contradict the basic generalist momentum hypothesis (see "Just the Opposite," page 24).
This trend was even more pronounced for the smaller caps, perhaps a predictable function of their lower liquidity and/or an indication that generalists flock to larger caps in times of increased market volatility, and specialists, by contrast, focus on smaller caps in search of outsized returns.
Moreover, the generalist mix in both market cap groupings was remarkably flat during the precipitous market downturn that began toward the end of 3Q15 amid well-publicized drug pricing, macroeconomic and other concerns.
Interestingly, there was considerable variation between individual companies in the index, with low and high values for generalist ownership in the below-10% and above-90% ranges, respectively, depending on the quarter, which may serve to validate further the result as statistically meaningful or relevant. There was little difference in this respect between the larger caps and the smaller caps.
In the second cut of the analysis, in which we moved the various large, multipurpose funds with a recognized specialist identity in life sciences from the specialist pool to the generalist pool, the result was unchanged -- while the curves certainly flattened, as would have been expected, there was still a negative trend, especially for the smaller caps. In other words, at the very least, relabeling those large funds as generalists did not contradict the base finding.
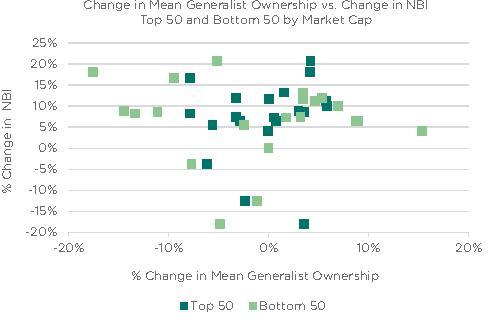
To address more specifically the correlation between generalist ownership and broader market moves, we also calculated the quarterly change in mean generalist percentage ownership of the top 50 and bottom 50 NBI cohorts and plotted those data against the corresponding change in the NBI itself.
The result is a basic scattershot, which demonstrates little, if any, relationship between the two, once again countermanding the basic generalist assertion (see "No Relation").
Conclusions
The drivers of any market are multivariate -- industry conditions, company events, regulatory and legislative oversight, broader macroeconomic indicators and numerous other factors influence investor sentiment and appetite every minute of every day. It is near-impossible to quantify the specific impact of any one of these, primarily because data in this context are, by definition, noisy.
As for the presence of a definitive causal link between generalist investor participation in the life sciences space and the movement of stock prices across a broad swath of companies, however, none is borne out in the data.
While the analytical methodology used herein is not beyond reproach, the results, at the very least, suggest a more complex answer to the basic question.
Opinions expressed in this article are the authors', and not necessarily those of Stifel Nicolaus & Co.
Companies and Institutions Mentioned
Amgen Inc. (NASDAQ:AMGN), Thousand Oaks, Calif.
Biogen Inc. (NASDAQ:BIIB), Cambridge, Mass.
Celgene Corp. (NASDAQ:CELG), Summit, N.J.
Gilead Sciences Inc. (NASDAQ:GILD), Foster City, Calif.
Tables
Levels of participation
An analysis of the top 20 investors in companies in the NASDAQ Biotechnology Index (NBI) showed substantially more generalist participation in the top 50 companies than in the bottom 50 ranked by market cap. Data were analyzed for 21 quarters beginning 4Q10 and ending 4Q15.The specialist category below includes large generalist funds with a recognized life sciences specialist identity, such as Fidelity, Janus, Jennison, T. Rowe Price and Wellington. Source: FactSet Research Systems Inc.
| Top 50 | Bottom 50 | |||
| Market cap range (at 4/27) | $1.4 - 136.4B | $66 - 350M | ||
| No. generalists | 620 | 84.9% | 554 | 85.2% |
| No. specialists | 110 | 15.1% | 96 | 14.8% |
| Total | 730 | 100.0% | 650 | 100.0% |
| Mean % ownership of 20 largest investors | 62.2% | 49.8% | ||
| Mean % generalist ownership among 20 largest investors | 41.1% | 29.5% | ||
Figures
Just the opposite
Contrary to conventional wisdom, while the NASDAQ Biotechnology Index (NBI) climbed from 4Q10 to 4Q15, the proportion of generalist ownership in NBI companies was flat to down. The analysis below includes the 50 largest and smallest NBI companies by market cap. The left axis shows the mean generalist ownership among the largest 20 investors in those companies. The right axis shows NBI performance.Large funds with a recognized life sciences specialist identity, such as Fidelity, Janus, Jennison, T. Rowe Price and Wellington, were counted as specialists; however, an analysis that counted them as generalists instead did not meaningfully change the results. Source: FactSet Research Systems Inc.
No relation
Over the 21 quarters concluding 4Q15, there was no correlation between changes in the NASDAQ Biotechnology Index (NBI) and changes in the proportion of generalist ownership in NBI companies. The analysis below includes the 50 largest and smallest NBI companies by market cap. The horizontal axis shows the quarterly change in mean generalist ownership among the largest 20 investors in those companies. The vertical axis shows quarterly changes in the NBI. Large funds with a recognized life sciences specialist identity, such as Fidelity, Janus, Jennison, T. Rowe Price and Wellington, were counted as specialists. Source: FactSet Research Systems Inc.